Swing Trade Plan for Silver (CFDs on Silver: USD/OZ)
H.1 Overview of the Current Trend
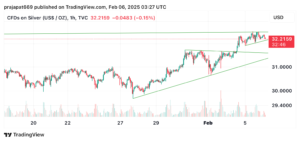
The price of silver has been trending upwards, forming consistent higher highs and higher lows. Recently, the price broke out of a symmetrical triangle pattern, signaling a continuation of bullish momentum. The current price is consolidating near $32.46, which represents an important resistance zone. However, if the price fails to sustain this level, it could lead to a potential bearish reversal. This dual outlook provides opportunities for both bullish and bearish trades depending on how the price reacts in the coming sessions.
Bullish Trade Idea
H.2 Entry Strategy
1. Pullback Entry: If the price pulls back to retest the breakout zone at $32.00, it offers an excellent buying opportunity. Look for candlestick confirmation (e.g., hammer, bullish engulfing) or technical indicators like an oversold RSI below 40.
2. Breakout Continuation Entry: Enter a long position if the price breaks above the resistance at $32.46 with strong volume, indicating bullish continuation.
H.3 Stop Loss Placement
Risk management is crucial. Place stop-loss orders to avoid excessive losses:
• Pullback Entry: Set the stop loss just below the breakout zone at $31.70 to protect against false breakouts.
• Breakout Entry: Place the stop loss below $32.10, near the consolidation area, to avoid getting caught in a reversal.
H.4 Target Levels
• Short-Term Target: $33.00, a resistance level aligned with prior price action.
• Medium-Term Target: $34.00, the next major resistance zone.
• Extended Target: Consider an ATR-based trailing stop-loss to capture further gains if momentum sustains.
H.5 Risk Management
Always risk only 1-2% of your trading capital on this trade. For instance, if your account size is $10,000 and you risk 1%, your maximum loss should be $100. Adjust your position size based on your entry and stop-loss distance.
Bearish Trade Idea
H.6 Entry Strategy
1. Rejection at Resistance: If the price fails to sustain above $32.46 and forms bearish patterns (e.g., shooting star, bearish engulfing), it indicates weakening momentum. Enter a short position upon confirmation.
2. Breakdown Entry: If the price breaks below the support at $32.00, enter a short position to capitalize on further downside.
H.7 Stop Loss Placement
• Rejection at Resistance: Set the stop loss above $32.60, beyond the resistance level.
• Breakdown Entry: Place the stop loss just above the support level at $32.10 to avoid getting stopped out by false breakdowns.
H.8 Target Levels
• Short-Term Target: $31.50, near the lower trendline of the uptrend.
• Medium-Term Target: $31.00, which aligns with historical support.
• Extended Target: $30.40, marking a possible return to the broader consolidation zone.
H.9 Risk Management
Similar to the bullish trade idea, limit your risk to 1-2% of your capital. Monitor key indicators such as declining volume during upward moves, as they can confirm weakening bullish momentum.
H.10 Confirmation Indicators for Both Ideas
1. RSI: Look for an RSI above 50 to confirm bullish momentum and below 50 for bearish sentiment. Overbought levels near 70 may signal a reversal for bearish trades.
2. Volume: Increased volume during breakouts supports the case for sustained moves. Conversely, declining volume near resistance suggests rejection and supports a bearish outlook.
3. Moving Averages: Keep an eye on the 50-EMA and 200-EMA. Bullish trades should align with prices above these moving averages, while bearish trades gain confidence if prices drop below them.
Exit Strategy
1. Bullish Exit:
• Book partial profits at $33.00.
• Use a trailing stop-loss to secure gains if the price approaches or exceeds $34.00.
• Exit entirely if a bearish reversal pattern forms near these targets.
2. Bearish Exit:
• Book partial profits at $31.50.
• Use a trailing stop-loss for further declines toward $31.00 or $30.40.
• Exit if a bullish momentum reclaims $32.46.
H.11 External Factors to Monitor
1. Geopolitical Events: Rising uncertainty often increases demand for silver as a safe-haven asset.
2. US Dollar Index (DXY): A strong USD negatively correlates with silver prices. Monitor DXY movements closely.
3. Economic Data: Key indicators like inflation, interest rates, and manufacturing output significantly influence silver prices.
Disclaimer
This plan is for educational purposes only and not financial advice. Trading involves significant risk and can lead to substantial losses. Always perform your due diligence and consult a licensed financial advisor before trading. Past performance is not indicative of future results.